What's New in FieldNET
If you’re aiming to save water and energy while protecting yield, FieldNET’s evolving tools make it easier—combining whole‑farm visibility with clear, field‑specific guidance. This blog will keep you updated on what’s new, why it matters, and how to use it to make every drop count on your farm.
Spring 2026
Customize your List View Layout
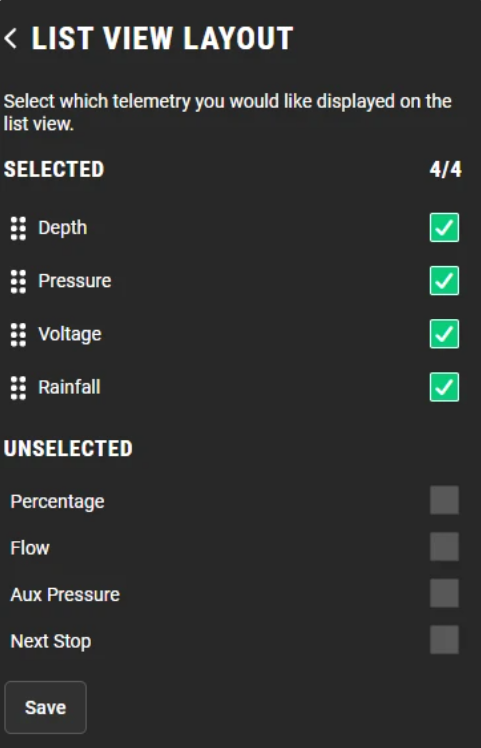
You can now edit your list view layout to better match your organization’s needs! Navigate to Organization Settings in the top-right corner and select List View Layout. From there, you can easily drag and reorder inputs or hide fields by unchecking them—giving you full control over how your list view appears.
Soft Barriers are now visible on the Map
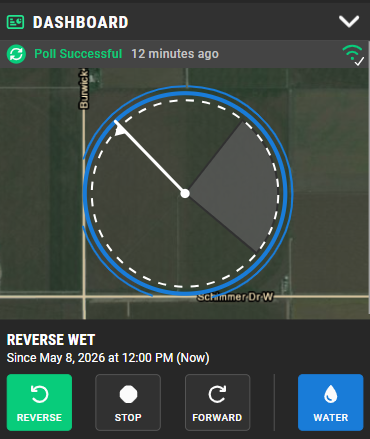
Easily spot your soft barrier angles directly on the map—no more digging through settings. This update gives you a faster, more intuitive view of your pivot boundaries at a glance. We’re continuing to build on this experience, with upcoming updates that will hide soft barriers outside the field area and bring auto stop/auto reverse controls back to the dashboard for the 700 series panel.
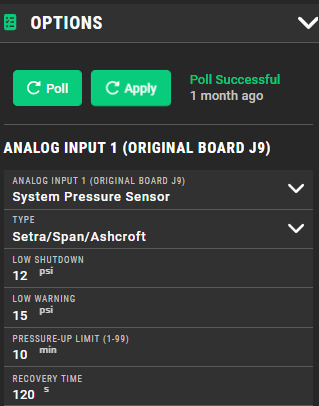
Configurable Pressure Recovery Time - Pivot Control
You can now adjust pressure recovery time on Pivot Control equipment to better match your system's needs. This value defaults to 3 minutes and can be customized in the Options dashboard.
Pressure recovery time determines how long the pivot is allowed to recover after dropping below the low-pressure shutdown threshold, giving you greater flexibility and control over system performance.
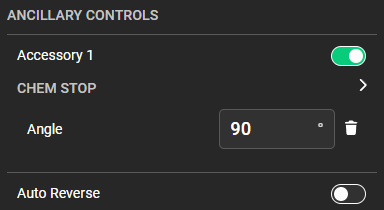
Chem Stop Feature (Pivot Control V2.7.04 or higher)
With Pivot Control firmware version 2.7.04 or later, the new Chem Stop feature allows you to easily set a specific position where the chemigation pump will automatically shut off. This helps prevent forgetting to manually turn off chemigation at the end of an application.
The Chem Stop feature is only available on Pivot Control systems running firmware version 2.7.04 or higher. To update your firmware, please contact your local dealer.
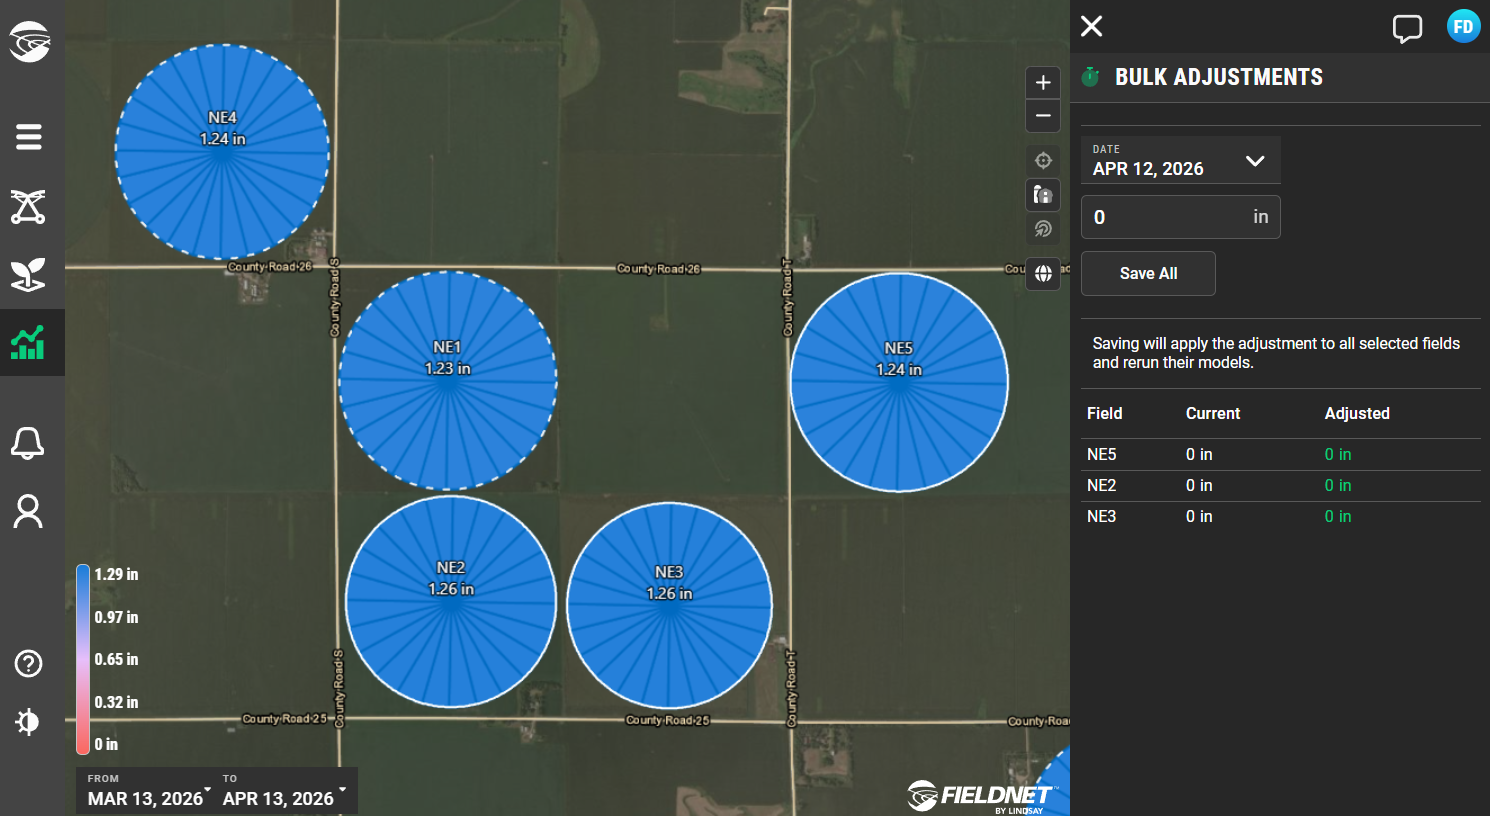
FieldNET Advisor - New Workflow for Editing Rainfall
You can now edit rainfall for multiple fields at once on desktop. Simply click a field and hold shift and a new Bulk Adjustment feature will pop up. Edit values as needed, click save, and then your edited fields will automatically update using the new rainfall value.
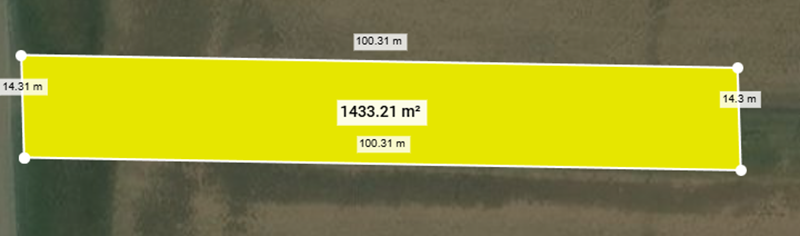
Precision VRI Enhancement: Distance-Aware Drawing in FieldNET
FieldNET now includes distance-aware drawing for Precision VRI polygons, giving you the ability to create control zones with accuracy previously limited to desktop mapping tools. This enhancement removes the need for freehand sketches and ensures every polygon reflects its intended dimensions and placement.
You can now define application areas using true distance measurements, such as marking a section of a field where crop type changes or positioning a control zone a specific distance from a road or lane. Exclusion zones around high-traffic areas can be drawn with confidence rather than estimation.
This upgrade supports more precise irrigation control, reduces water waste, and strengthens crop protection and management decisions across the entire field.
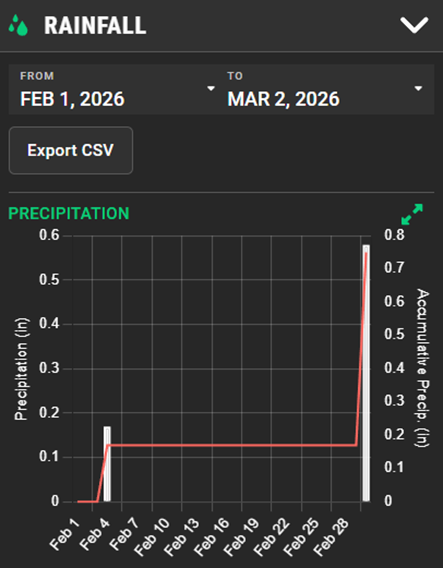
Equipment Rainfall Report Enhancement
Thanks to your feedback, the Equipment Rainfall Report just got better! It now sums up each day's precipitation, features a new line graph showing accumulated totals, and fixes the readability problem that occurred in light mode.
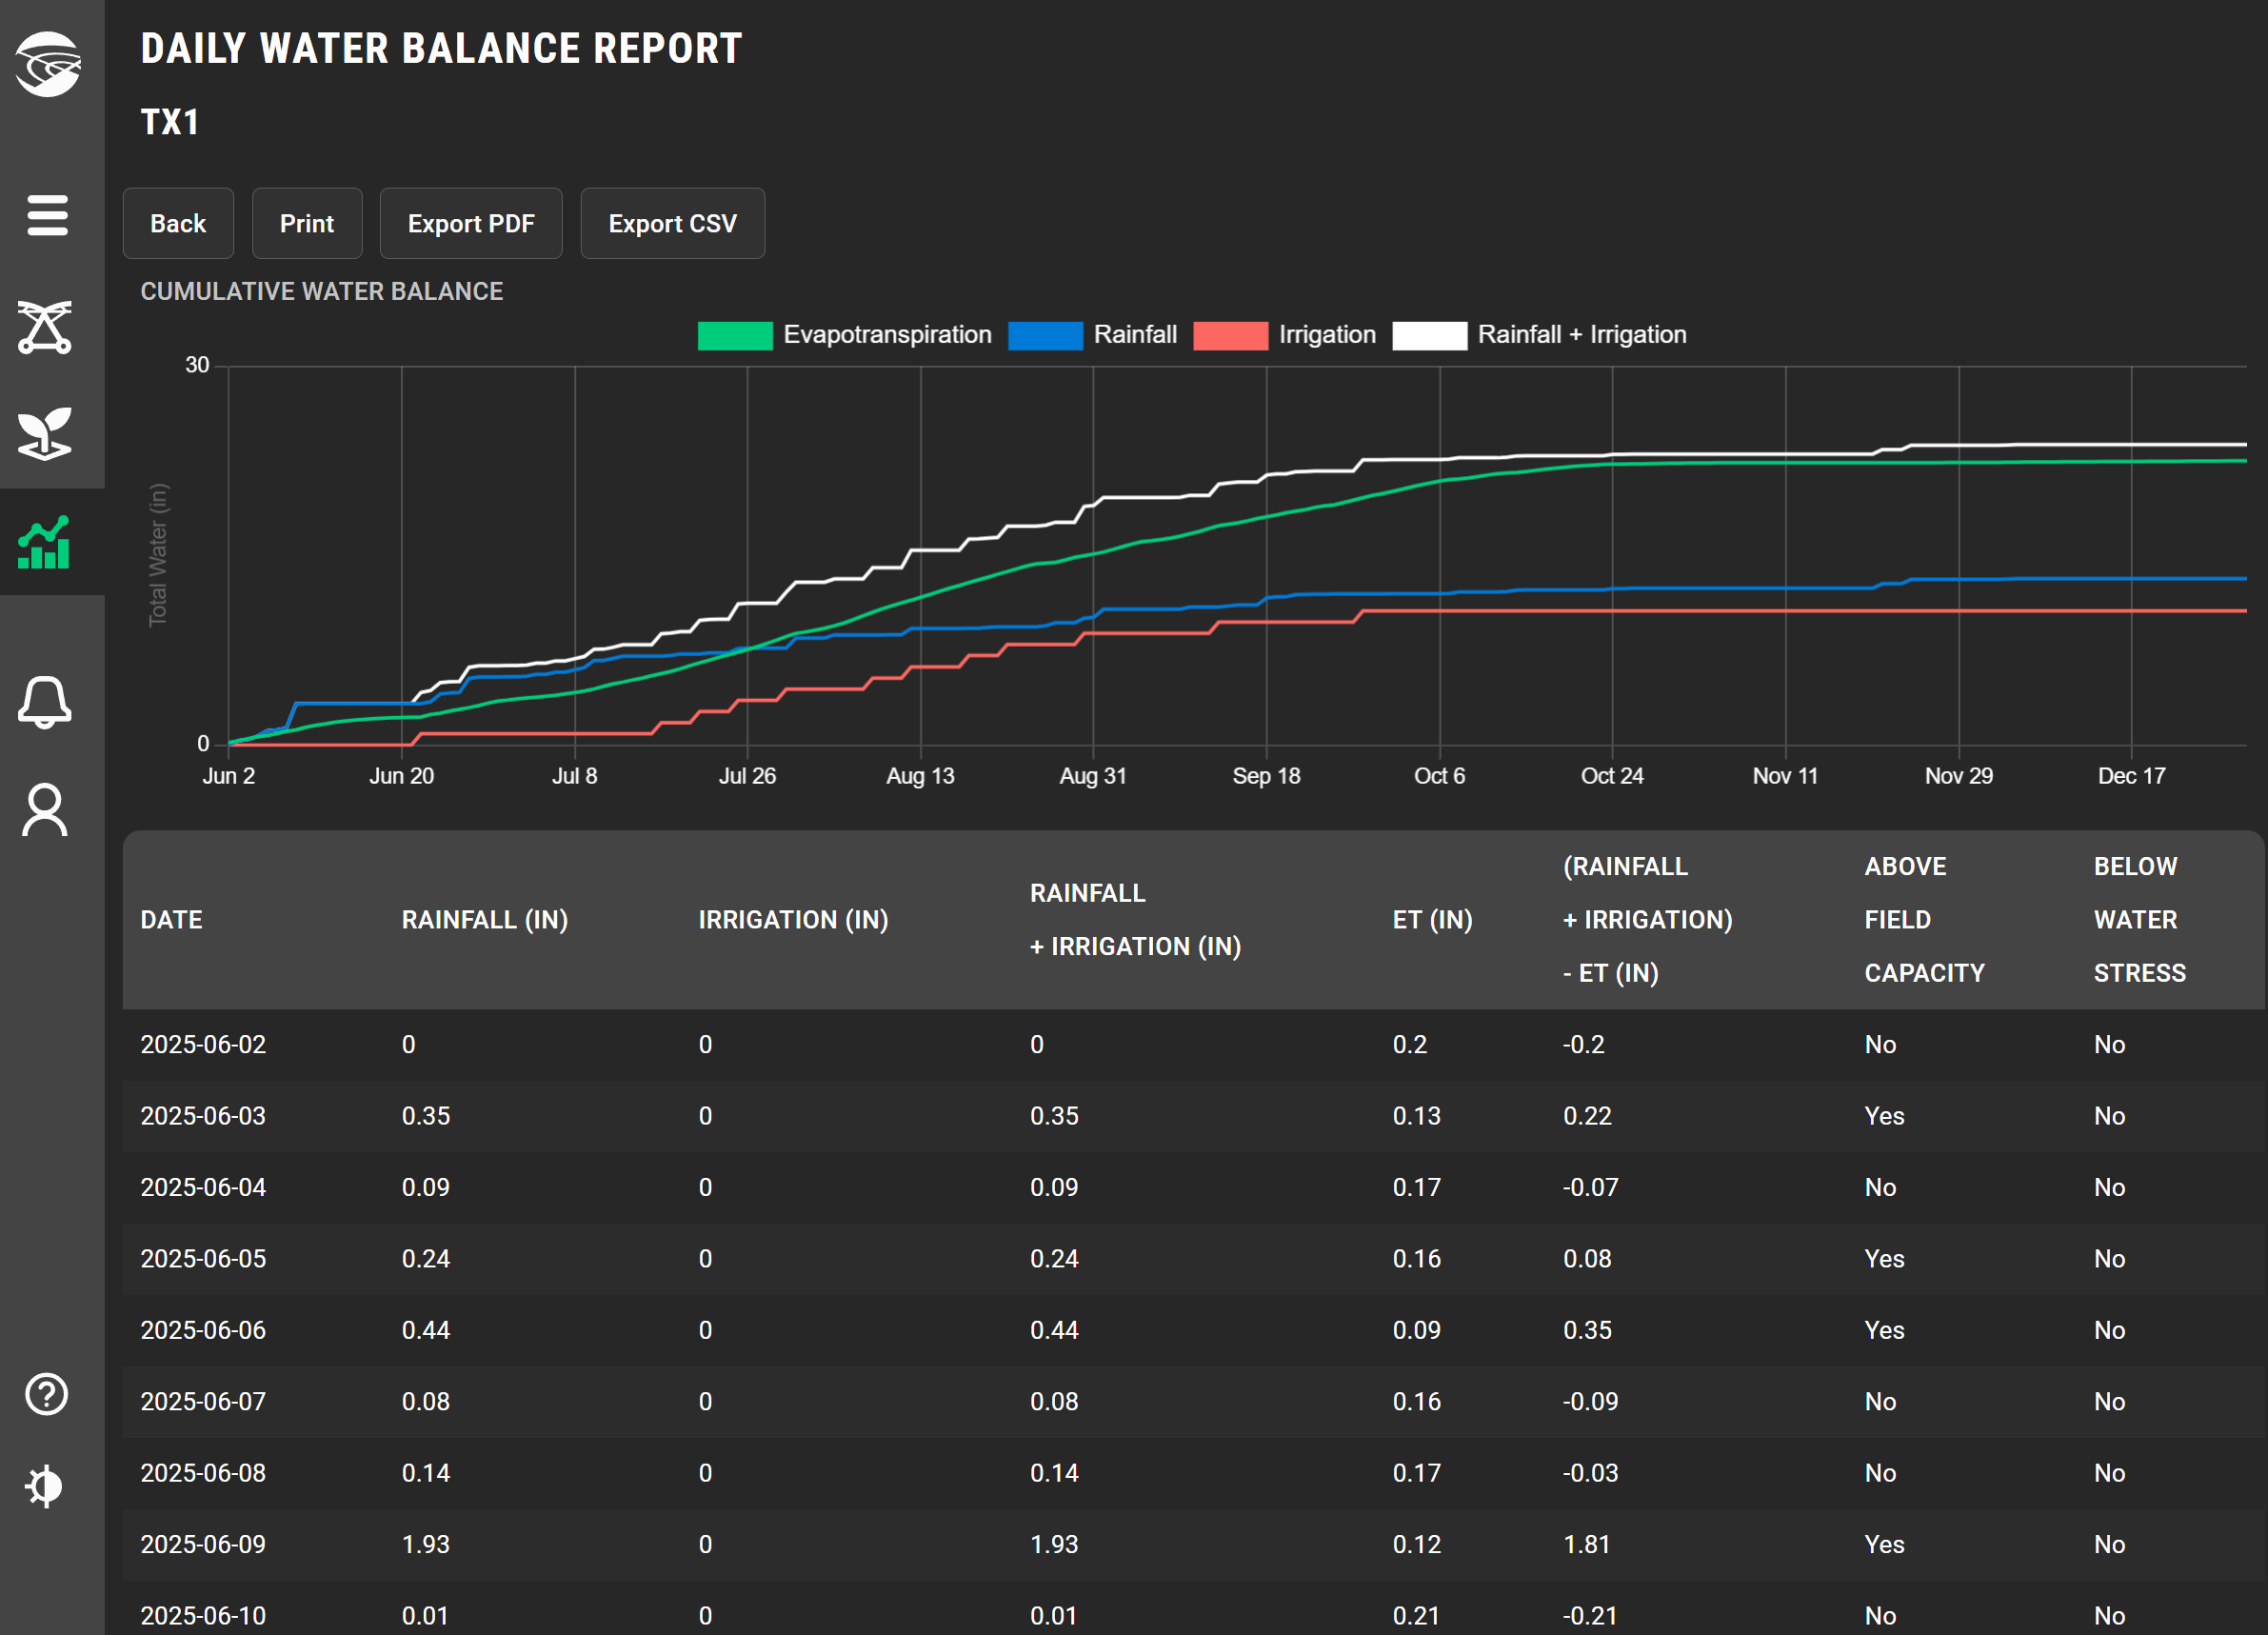
FieldNET Advisor - Water Balance Graph
The Water Balance Report has been updated to include a graph that shows how total rainfall, irrigation, and crop water use (evapotranspiration) compare over the growing season for each field.
This makes it easier to check whether you are keeping up with crop water use or if you can reduce application rates. Daily values for each component are also provide in a table below the graph. Simply click the name of a field in the Water Balance Report to view this data for each field.
Winter 2026
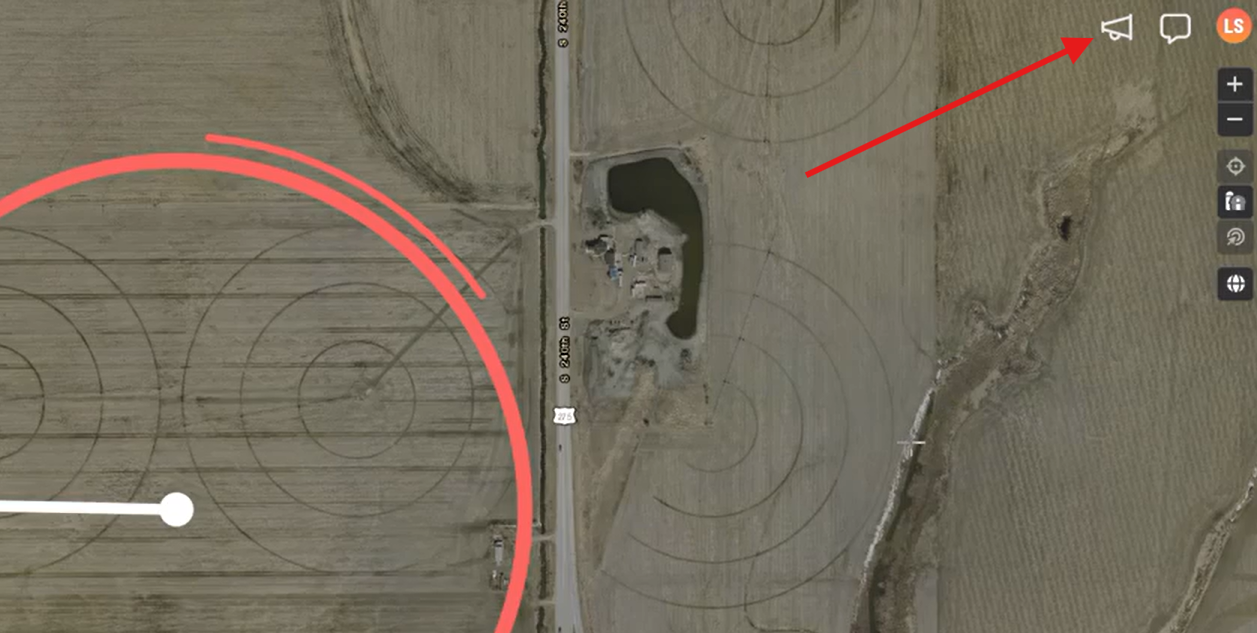
New Updates Notifications
The “What’s New” feature gives a simple, visible way to stay informed about the latest updates in FieldNET. A new icon alerts when new features, enhancements, or improvements have been released since your last login.
Customers and dealers can quickly discover new functionality to take advantage of improvements as it becomes available.
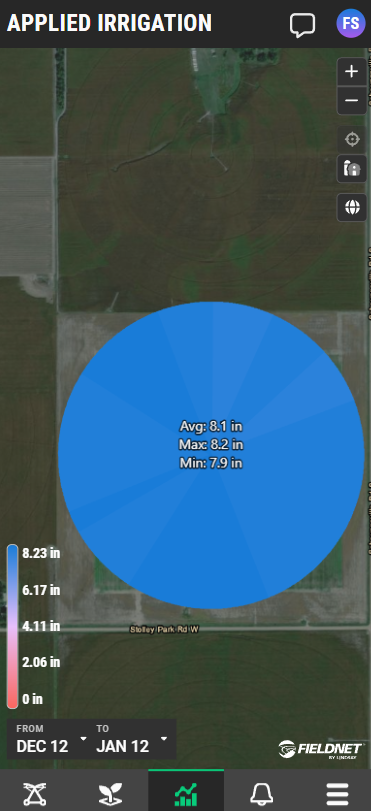
Added Text Based Callouts on Applied Irrigation Report
To improve visibility and make it easier to see your equipment’s applied irrigation data, the Applied Irrigation report now includes Average, Max, and Min values for each piece of equipment. This enhancement helps you quickly interpret the irrigation amounts applied across your organization.
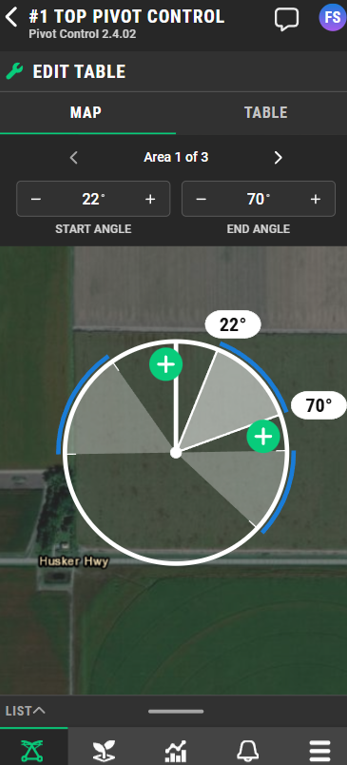
Improved Endgun Dashboard for Smaller Screens
We improved the endgun dashboard for smaller screens by separating the map and table into individual tabs, creating more usable space and adding inline controls so you can create Endgun areas directly from the map. The Done button now appears as soon as changes are made, eliminating the need to scroll to save your updates.
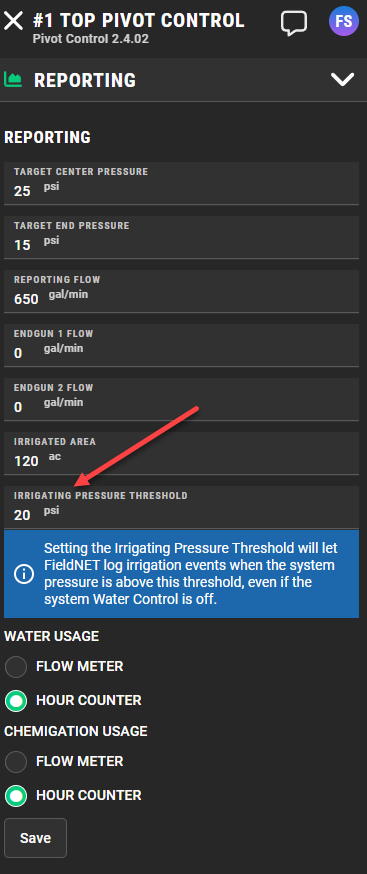
Use Pressure to Track Irrigation Events
Users can now track irrigation events and water usage based on pivot pressure readings, not just the water key. This is especially useful for systems with multiple wells or no pump connected to the water key. Setting the Irrigating Pressure Threshold under the Reporting menu will let FieldNET log irrigation events when the system pressure is above this threshold, even if the system water control is off.
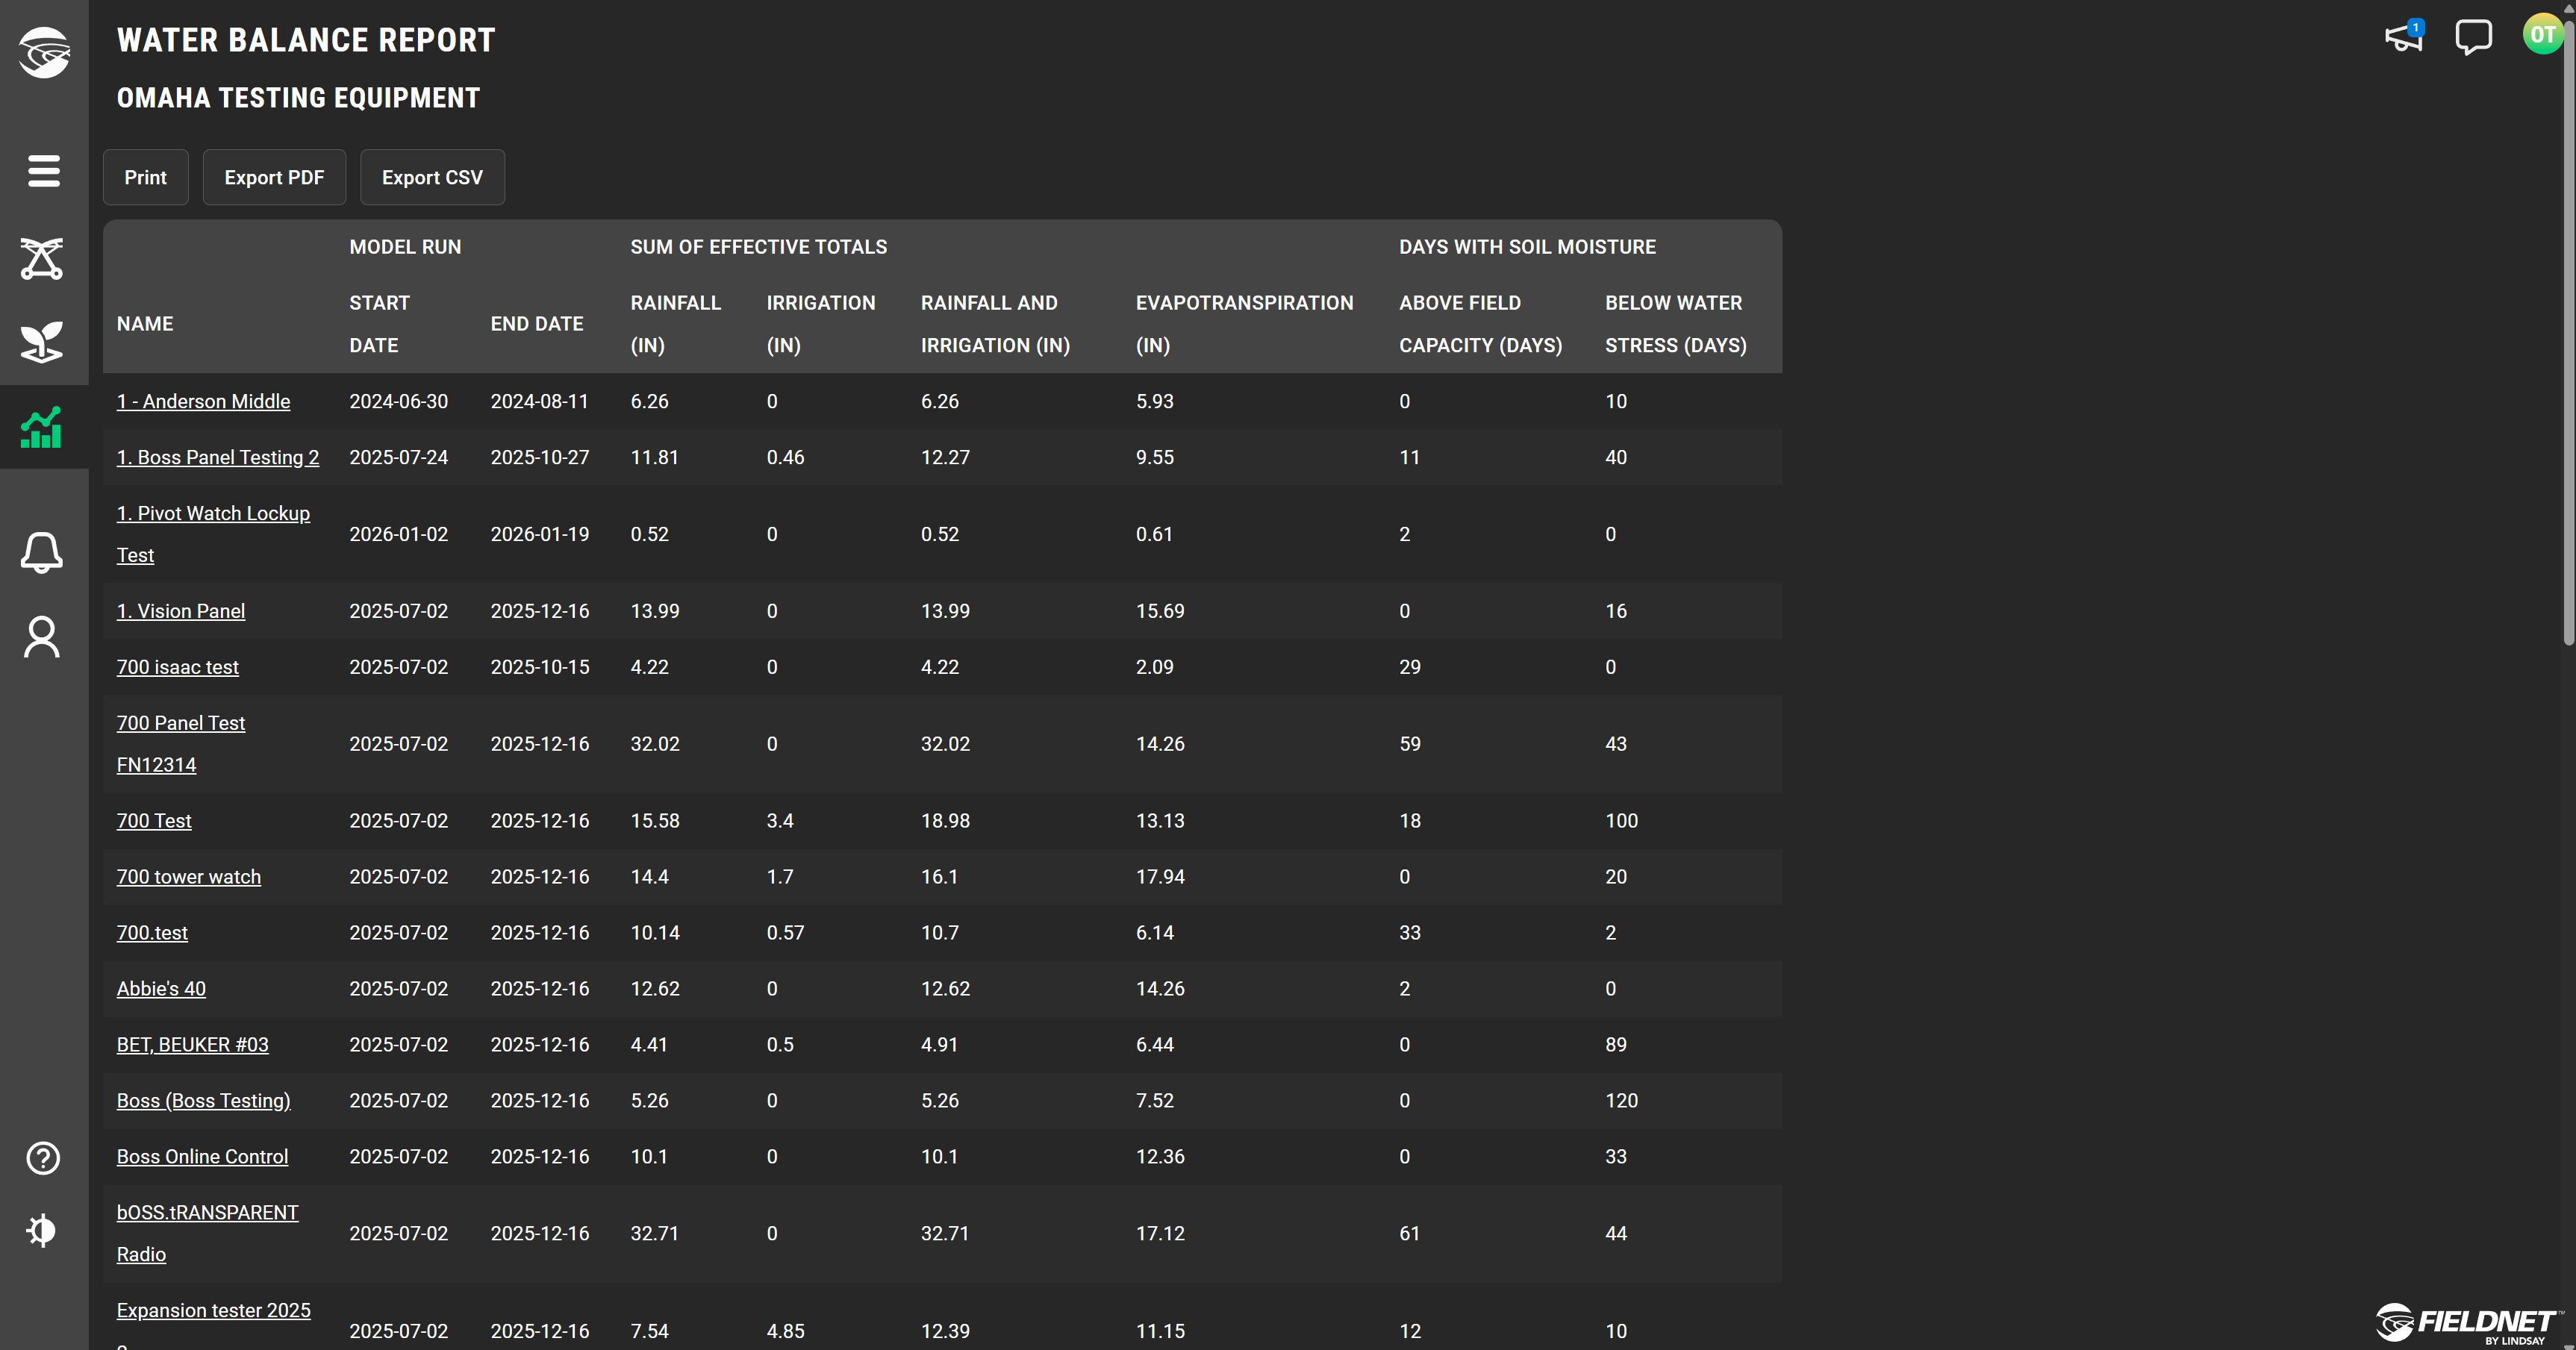
FieldNET Advisor - Water Balance Report
Ever wondered if your irrigation rates are keeping up with crop water use? What about how much rainfall you’re fields have had season to date? The new Water Balance Report shows how each field is tracking rainfall and irrigation relative to crop water use. You can also see a count for the number of days your fields have been too wet or too dry and experiencing water stress.
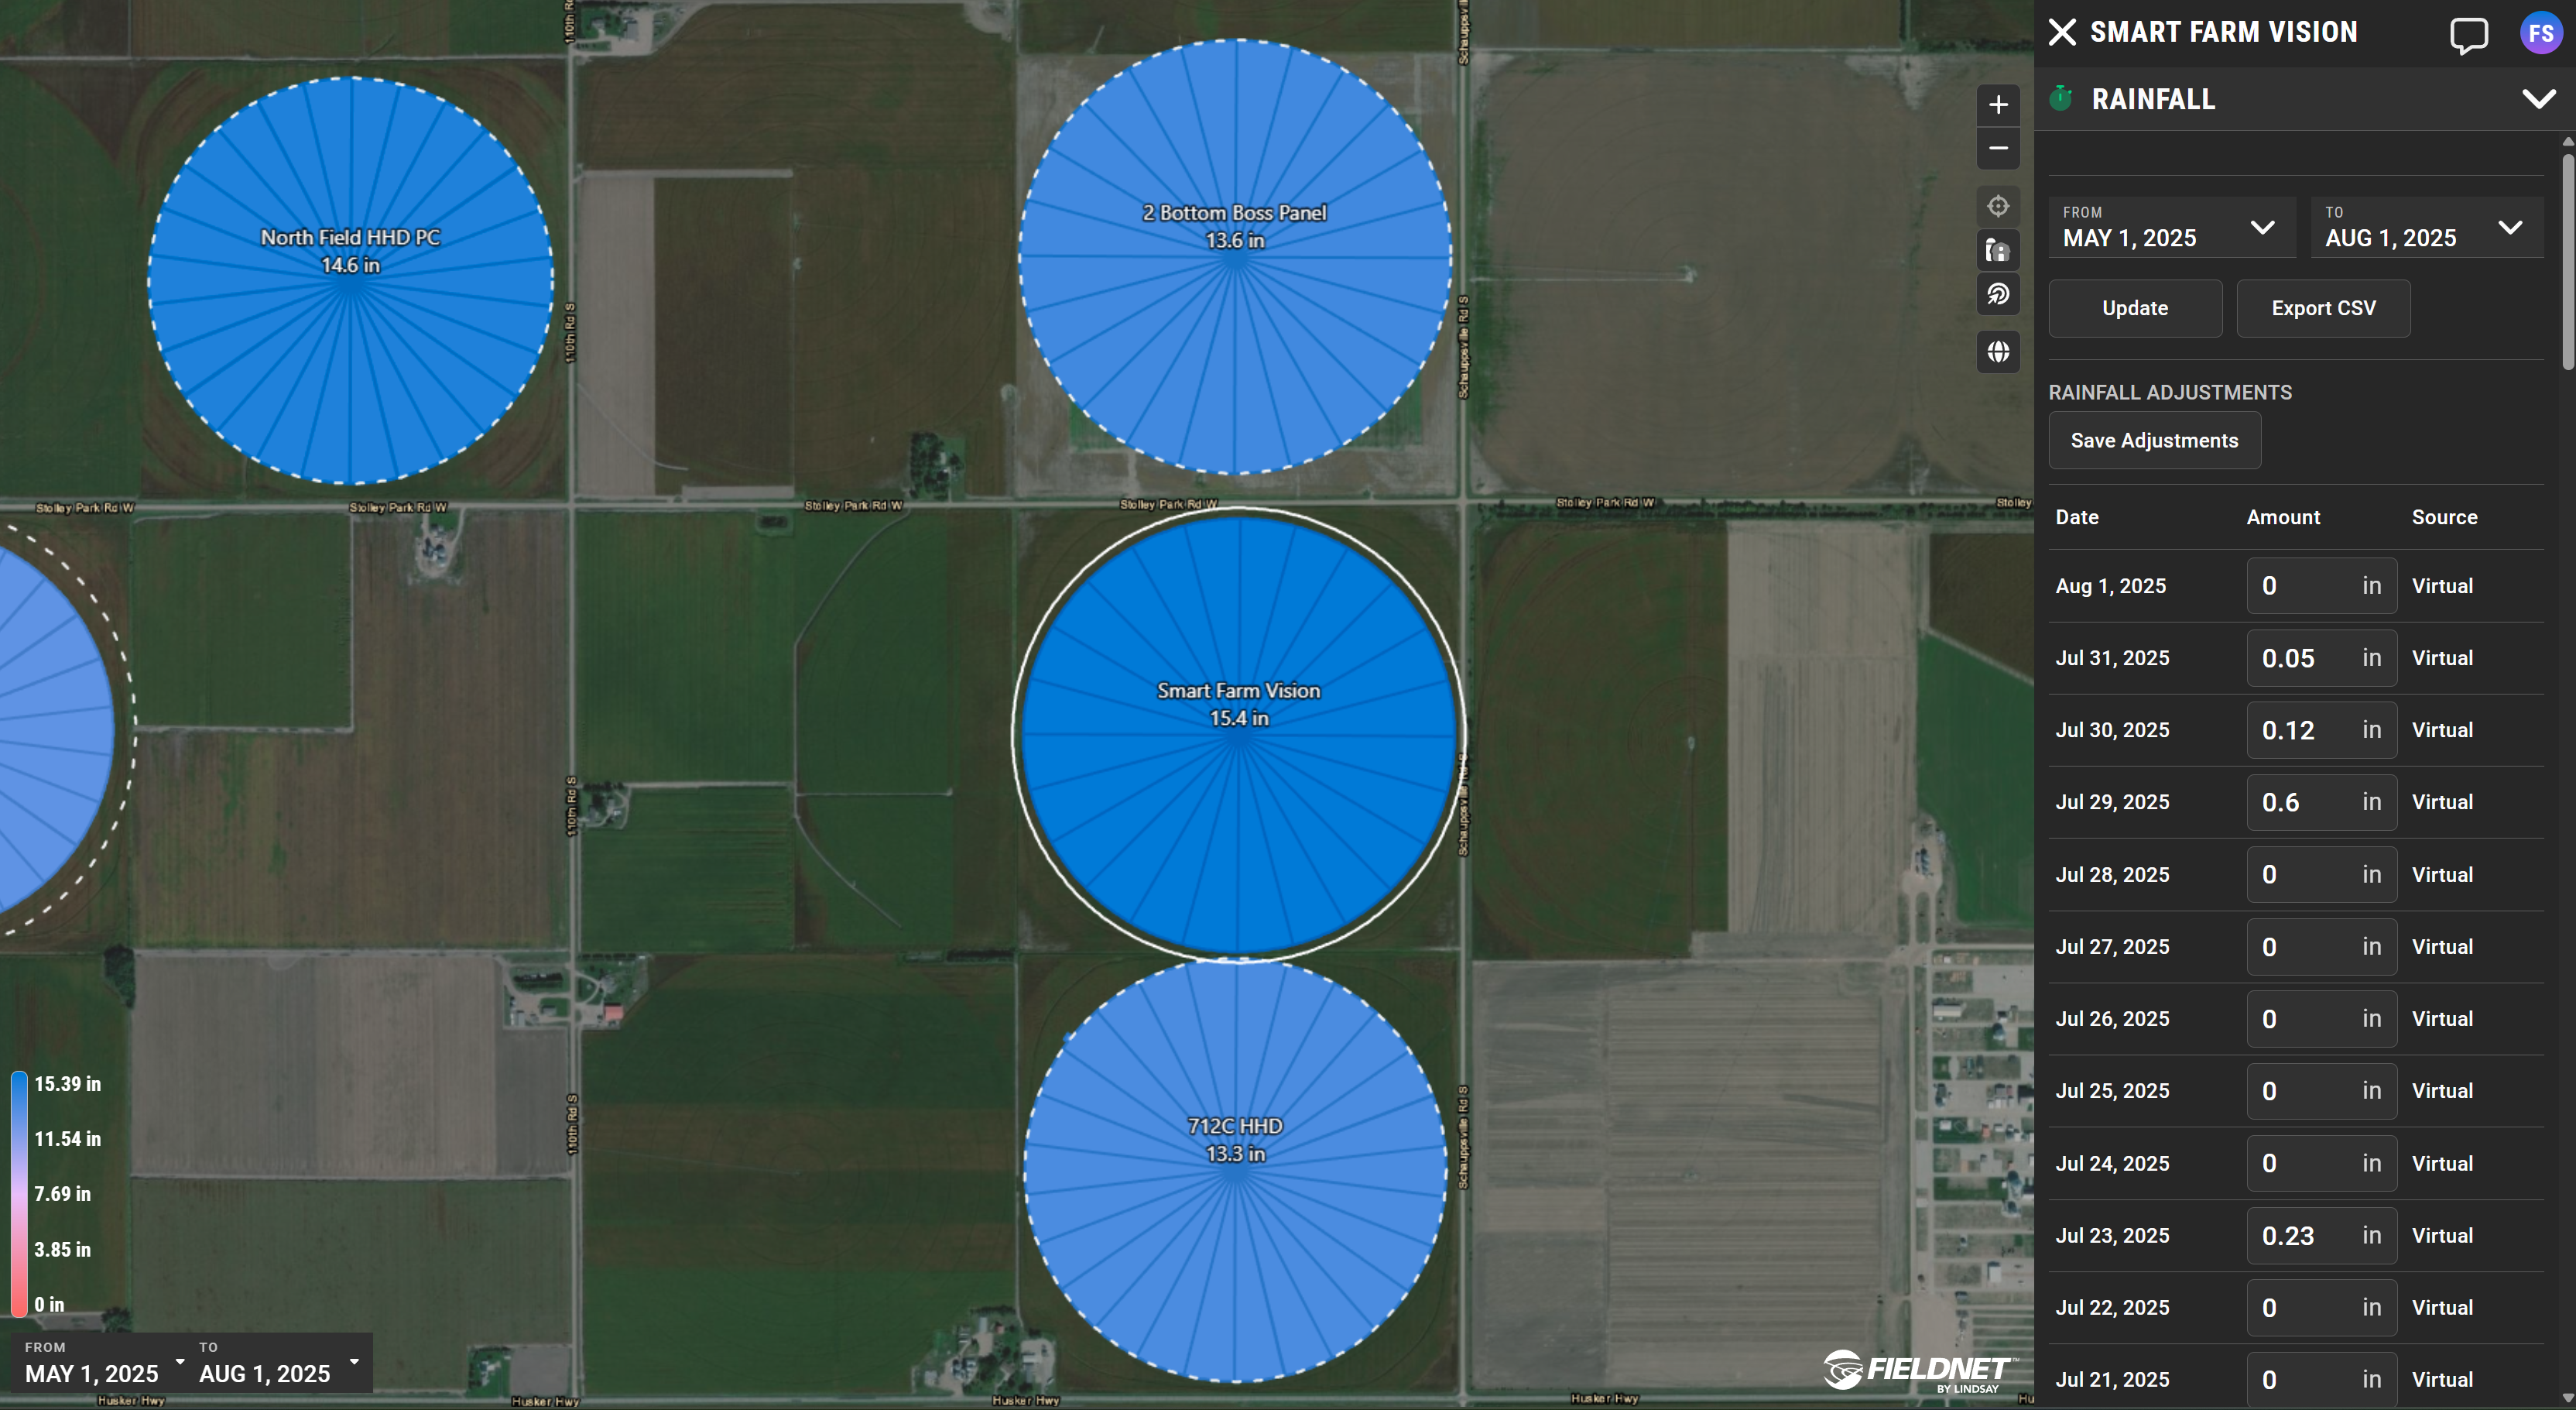
FieldNET Advisor - Rainfall Enhancements
See the amount of rainfall for each of your fields on the map for any time period you select over the season on the Weather report layer. We’ve even added text based callouts to make it easier to know the exact amount of rainfall for each field while looking at the map.
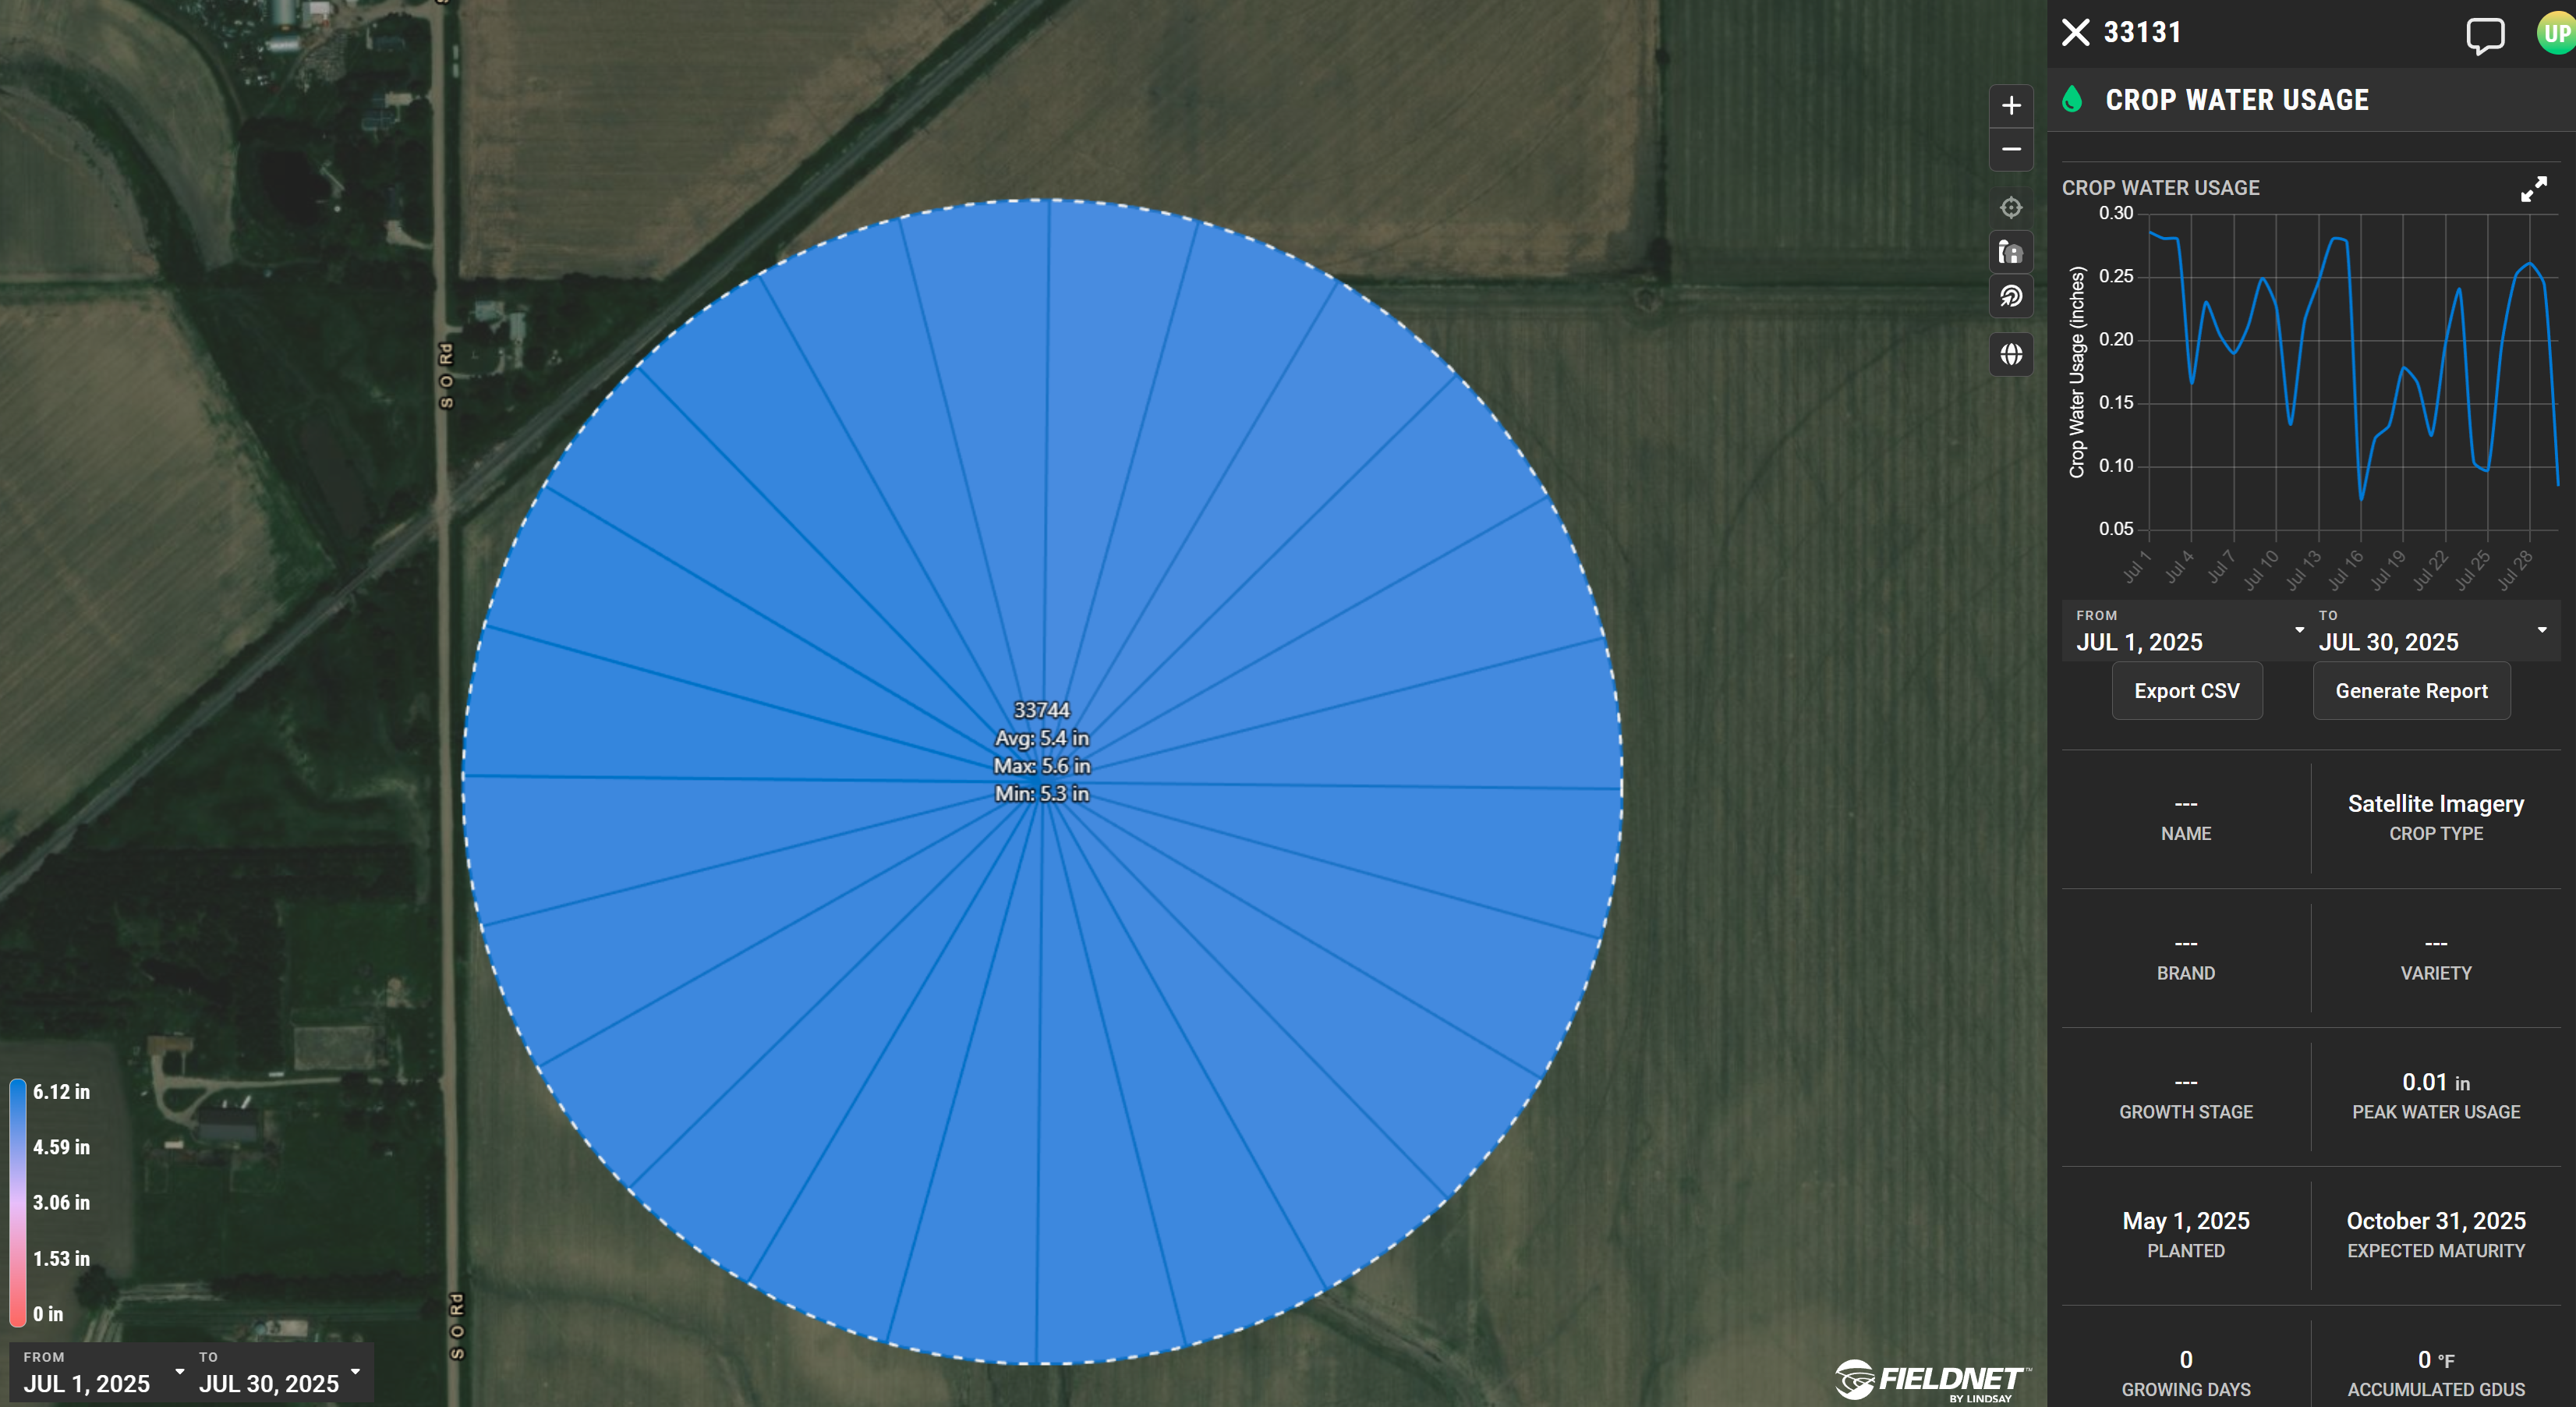
FieldNET Advisor - Crop Water Usage Enhancements
You can now select specific time intervals to see total crop water usage for each field on the map. We report the minimum, maximum, and average values in text. A graph is also displayed for each sector as you tap/click to select.